
Diving straight into writing Python code, initializing notebooks, or training complex machine learning models without a clear roadmap is a recipe for broken systems, technical debt, and wasted engineering hours. In an enterprise environment, raw coding capability is only a small fraction of the equation. To build predictive systems that scale, add real business value, and maintain structural integrity over time, engineers must adhere to a disciplined, repeatable framework.
A structured data science methodology serves as the core operational architecture of any successful data initiative. It bridges the gap between ambiguous business problems and deployed, automated software systems. Without this systematic pipeline, models fail to move past the local prototyping phase, data pipelines become unmaintainable spaghetti code, and teams struggle to replicate their results.
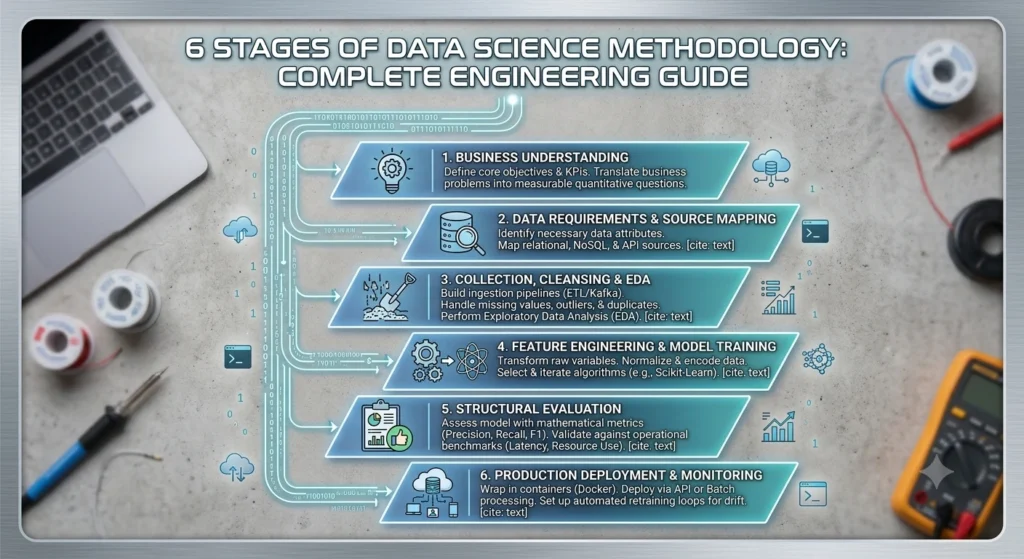
This comprehensive guide breaks down the industry-standard data science lifecycle into six distinct, engineering-focused stages. By understanding and implementing this comprehensive data science methodology, you can transition out of isolated script writing and begin designing robust, production-grade pipelines.
The Architecture of an Iterative Engineering Lifecycle
An exceptional data science methodology rarely operates linearly. It functions as a continuous, highly iterative feedback loop. When a metric falls short during validation or a data pipeline breaks under load, the framework guides you backward to the exact phase requiring refinement.
┌────────────────────────────────────────────────────────┐
│               1. Business Understanding                │
└───────────────────────────┬────────────────────────────┘
                            ▼
┌────────────────────────────────────────────────────────┐
│         2. Data Requirements & Source Mapping          │
└───────────────────────────┬────────────────────────────┘
                            ▼
┌────────────────────────────────────────────────────────┐
│       3. Data Collection, Cleansing & EDA              │
└───────────────────────────┬────────────────────────────┘
                            ▼
┌────────────────────────────────────────────────────────┐
│     4. Feature Engineering & Model Training            │
└───────────────────────────┬────────────────────────────┘
                            ▼
┌────────────────────────────────────────────────────────┐
│               5. Structural Evaluation                 │
└───────────────────────────┬────────────────────────────┘
                            ▼
┌────────────────────────────────────────────────────────┐
│        6. Production Deployment & Monitoring           │
└────────────────────────────────────────────────────────┘
1. Business Understanding in Data Science Methodology
The foundation of any technical project does not belong in an Integrated Development Environment (IDE); it belongs in the domain of problem definition. Before loading a single dataset or importing a single open-source library, an engineer must accurately define the core business objective.
The primary goal of this initial phase within a strict data science methodology is to translate ambiguous human problems into precise, measurable quantitative questions. For instance, a stakeholder stating, “We need to reduce customer churn,” is a business problem. A data engineer must translate that into a technical objective: “We need to construct a binary classification model that predicts the probability of a user cancelling their subscription within the next 30 days, utilizing historical behavioral logs.”
Key Tasks in This Stage:
- Identify Stakeholder Requirements: Determine exactly who will use the output of the system and how it impacts operational workflows.
- Define Project Benchmarks: Establish clear, quantifiable Key Performance Indicators (KPIs). Will success be measured by a 5% reduction in infrastructure overhead, an increase in recommendation click-through rates, or a specific baseline metric like minimizing false positives in fraud detection?
- Assess Constraints: Map out resource limitations, data privacy guardrails (such as GDPR or CCPA compliance), computational budgets, and timeframes.
2. Data Requirements & Source Mapping
With a clearly defined problem in hand, the next phase is to determine what data inputs are necessary to solve it. This stage focuses on identifying the specific attributes, frequencies, and structural formats required to train a reliable model.
Data requirements dictate the technical stack and architecture of the collection pipelines that follow. If your predictive model requires real-time clickstream events, your data requirements will look vastly different than a system built for daily or weekly batch processing of financial records. Executing this step precisely ensures your core data science methodology remains aligned with your initial business objectives.
Key Tasks in This Stage:
- Determine Data Requirements: Specify the exact variables, features, and historical timeframes needed. For example, do you need transactional data from the past five years, or will the last six months of localized behavior suffice?
- Map Source Systems: Locate where this data natively resides. This involves identifying specific relational databases (SQL), NoSQL document stores, distributed file systems, external third-party API endpoints, or unstructured server logs.
- Define Data Types and Formats: Document whether the target data is structured (tabular SQL tables), semi-structured (JSON payloads from webhooks), or completely unstructured (audio files, image blocks, or raw text documents).
3. Data Collection, Cleansing & Exploratory Data Analysis (EDA)
Once the data requirements are locked in, engineers move to execution: pulling the data, processing it, and analyzing its internal structure. Raw data collected from production systems is notoriously chaotic, inconsistent, and incomplete. This phase of the standard data science methodology ensures the data is clean, reliable, and deeply understood before any model training occurs.
Data Extraction & Pipeline Integration
Engineers write ingestion scripts to extract records from source systems. This might involve setting up automated ETL (Extract, Transform, Load) pipelines, configuring Kafka streams for real-time messaging, or writing targeted SQL queries to compile historical snapshots.
Data Cleansing Formats
Garbage in, garbage out is the golden rule of machine learning systems. Cleansing is often the most time-consuming phase of the lifecycle, requiring systematic handling of:
- Missing Values: Deciding whether to drop rows containing null variables, or apply statistical imputation techniques (e.g., replacing missing values with the column mean, median, or a predicted value).
- Duplicate Records: Identifying and removing redundant rows caused by application bugs or pipeline errors to prevent model bias.
- Outliers: Spotting extreme anomalies within the dataset and determining whether they represent true systemic behavior or corrupt sensor data that must be filtered out.
Exploratory Data Analysis (EDA)
With a clean dataset established, you perform EDA to uncover the underlying statistical properties of your variables. Using visualization frameworks and descriptive statistics, you analyze distribution curves, calculate skewness, and build correlation matrices to find patterns and hidden relationships between your target variable and potential features.
4. Feature Engineering & Applying Data Science Methodology to Model Training
This phase is where the core machine learning logic is constructed. Feature engineering is the art and science of transforming raw variables into highly descriptive input indicators that help machine learning algorithms learn efficiently.
Feature Engineering Techniques
- Scaling and Normalization: Bringing all numerical variables onto an equal scale (e.g., between 0 and 1) to ensure large numbers don’t accidentally overwhelm model weights during optimization.
- One-Hot Encoding: Converting categorical strings (like “Region: North”, “Region: West”) into binary numerical arrays ($0$ or $1$) that algorithms can mathematically interpret.
- Derived Variables: Creating entirely new features by mathematically combining existing data points, such as calculating the ratio of a user’s transaction amount relative to their average lifetime spend.
Model Training Frameworks
Once your features are curated, the dataset is split—typically into training, validation, and testing partitions.
1. Business Understanding in Data Science Methodology
The foundation of any technical project does not belong in an Integrated Development Environment (IDE); it belongs in the domain of problem definition. Before loading a single dataset or importing a single open-source library, an engineer must accurately define the core business objective.
The primary goal of this initial phase within a strict data science methodology is to translate ambiguous human problems into precise, measurable quantitative questions. For instance, a stakeholder stating, “We need to reduce customer churn,” is a business problem. A data engineer must translate that into a technical objective: “We need to construct a binary classification model that predicts the probability of a user cancelling their subscription within the next 30 days, utilizing historical behavioral logs.”
Key Tasks in This Stage:
- Identify Stakeholder Requirements: Determine exactly who will use the output of the system and how it impacts operational workflows.
- Define Project Benchmarks: Establish clear, quantifiable Key Performance Indicators (KPIs). Will success be measured by a 5% reduction in infrastructure overhead, an increase in recommendation click-through rates, or a specific baseline metric like minimizing false positives in fraud detection?
- Assess Constraints: Map out resource limitations, data privacy guardrails (such as GDPR or CCPA compliance), computational budgets, and timeframes.
2. Data Requirements & Source Mapping
With a clearly defined problem in hand, the next phase is to determine what data inputs are necessary to solve it. This stage focuses on identifying the specific attributes, frequencies, and structural formats required to train a reliable model.
Data requirements dictate the technical stack and architecture of the collection pipelines that follow. If your predictive model requires real-time clickstream events, your data requirements will look vastly different than a system built for daily or weekly batch processing of financial records. Executing this step precisely ensures your core data science methodology remains aligned with your initial business objectives.
Key Tasks in This Stage:
- Determine Data Requirements: Specify the exact variables, features, and historical timeframes needed. For example, do you need transactional data from the past five years, or will the last six months of localized behavior suffice?
- Map Source Systems: Locate where this data natively resides. This involves identifying specific relational databases (SQL), NoSQL document stores, distributed file systems, external third-party API endpoints, or unstructured server logs.
- Define Data Types and Formats: Document whether the target data is structured (tabular SQL tables), semi-structured (JSON payloads from webhooks), or completely unstructured (audio files, image blocks, or raw text documents).
3. Data Collection, Cleansing & Exploratory Data Analysis (EDA)
Once the data requirements are locked in, engineers move to execution: pulling the data, processing it, and analyzing its internal structure. Raw data collected from production systems is notoriously chaotic, inconsistent, and incomplete. This phase of the standard data science methodology ensures the data is clean, reliable, and deeply understood before any model training occurs.
Data Extraction & Pipeline Integration
Engineers write ingestion scripts to extract records from source systems. This might involve setting up automated ETL (Extract, Transform, Load) pipelines, configuring Kafka streams for real-time messaging, or writing targeted SQL queries to compile historical snapshots.
Data Cleansing Formats
Garbage in, garbage out is the golden rule of machine learning systems. Cleansing is often the most time-consuming phase of the lifecycle, requiring systematic handling of:
- Missing Values: Deciding whether to drop rows containing null variables, or apply statistical imputation techniques (e.g., replacing missing values with the column mean, median, or a predicted value).
- Duplicate Records: Identifying and removing redundant rows caused by application bugs or pipeline errors to prevent model bias.
- Outliers: Spotting extreme anomalies within the dataset and determining whether they represent true systemic behavior or corrupt sensor data that must be filtered out.
Exploratory Data Analysis (EDA)
With a clean dataset established, you perform EDA to uncover the underlying statistical properties of your variables. Using visualization frameworks and descriptive statistics, you analyze distribution curves, calculate skewness, and build correlation matrices to find patterns and hidden relationships between your target variable and potential features.
4. Feature Engineering & Applying Data Science Methodology to Model Training
This phase is where the core machine learning logic is constructed. Feature engineering is the art and science of transforming raw variables into highly descriptive input indicators that help machine learning algorithms learn efficiently.
Feature Engineering Techniques
- Scaling and Normalization: Bringing all numerical variables onto an equal scale (e.g., between 0 and 1) to ensure large numbers don’t accidentally overwhelm model weights during optimization.
- One-Hot Encoding: Converting categorical strings (like “Region: North”, “Region: West”) into binary numerical arrays ($0$ or $1$) that algorithms can mathematically interpret.
- Derived Variables: Creating entirely new features by mathematically combining existing data points, such as calculating the ratio of a user’s transaction amount relative to their average lifetime spend.
Model Training Frameworks
Once your features are curated, the dataset is split—typically into training, validation, and testing partitions.
Total Dataset ───► [ Training Set (70%) ] ──► Used to fit model weights
──► [ Validation Set (15%) ] ─► Used to tune hyperparameters
──► [ Testing Set (15%) ] ───► Used for final verification
You select algorithms best suited for your problem layout—ranging from classic linear regressions and gradient-boosted decision trees to deep neural networks. Utilizing open-source ecosystems like Scikit-Learn documentation, engineers run iterative training loops, adjusting hyperparameters to maximize the model’s predictive capabilities without causing overfitting.
5. Structural Evaluation within the Data Science Methodology
Before code is ever pushed to a live staging environment, it must undergo rigorous mathematical and operational validation. The evaluation stage of your broader data science methodology measures how your trained model behaves when confronted with fresh data it has never seen before.
Engineers use a variety of evaluation metrics depending entirely on the nature of the task:
| Problem Type | Common Evaluation Metrics | Core Purpose |
| Classification (e.g., Fraud/Not Fraud) | Precision, Recall, F1-Score, ROC-AUC | Measures prediction accuracy, balancing false positives vs. false negatives. |
| Regression (e.g., Price Prediction) | Mean Absolute Error (MAE), Root Mean Squared Error (RMSE) | Quantifies the average mathematical distance between predictions and actual values. |
Beyond pure statistical metrics, the model must also be evaluated against operational benchmarks:
- Inference Latency: Does the model generate predictions fast enough to support a real-time web application, or does it take too long to compute?
- Resource Consumption: Does running the model require excessive CPU, memory, or GPU overhead that exceeds the production budget?
If the model fails to hit these operational and statistical benchmarks, the team loops back to earlier stages of the data science methodology—either to gather alternative data points, engineer stronger features, or select a completely different algorithmic approach.
6. Production Deployment & Monitoring
The final stage of a professional data science methodology is deploying the validated model into a live production environment where it can interact with real systems and users. This is where data science intersects directly with modern DevOps and software engineering principles.
Deployment Archetypes
- API Microservices: Wrapping the model inside a lightweight container (like Docker) and exposing it via a REST or gRPC API endpoint (using frameworks like FastAPI). This allows other web applications to pass data payloads to the model and receive instant predictions.
- Batch Processing Pipelines: Configuring the model to run on a scheduled cron job or orchestrator (like Apache Airflow), pulling large blocks of data from a data warehouse overnight, calculating predictions in bulk, and writing the results back to a database.
Continuous Monitoring & Maintenance
Deployment is not the end of the journey. Once a model is live in production, it begins to age. Real-world conditions change over time, leading to a phenomenon known as Model Drift or Data Drift. For instance, an e-commerce recommendation model trained on data from June may perform poorly during holiday shopping spikes in December because consumer purchasing habits have fundamentally shifted.
To combat this, engineers build automated monitoring systems that continuously track the statistical distributions of incoming live data and monitor model performance over time. When performance dips below an acceptable threshold, alerting systems trigger automated CI/CD retraining loops to update the model with fresh data, ensuring the overall data science methodology yields accurate, reliable, and valuable systems over the long term.
If you are setting up your infrastructure architecture for the first time, check out our baseline guide on building clean automation frameworks to streamline your live deployments.
No responses yet